| A low-cost, environment-friendly
device for augmenting rice cultivation
Dr. Musherraf Husain
The Daily Star, 29-06-2005
 Chief
Scientific Officer, ARD, BRRI, Gazipur Urea is one of the most
important fertilisers needed in rice cultivation. However, among
all fertilizers, urea (which contains nitrogen) use efficiency
in rice cultivation is the lowest (maximum only 30 percent), since
it is highly mobile within the soil plant system. This is why
urea is usually applied in splits at different stages of crop
growth to minimise the loss of applied urea and improve the efficiency
of nitrogen use. The fate of applied urea is: uptaken by the plants
(up to 33%), loss through volatilisation, surface run off and
leaching down. A large fraction of the applied urea is volatilized,
which eventually causes environmental pollution. Flexibility of
the farmers in adjusting the timing and amount of fertilizer applied
offers great potential to synchronise N application with the demand
of the rice crop in real time. When N application is not synchronized
with crop demand, N losses from the soil plant system are large
leading to low N fertilizer use efficiency. Chief
Scientific Officer, ARD, BRRI, Gazipur Urea is one of the most
important fertilisers needed in rice cultivation. However, among
all fertilizers, urea (which contains nitrogen) use efficiency
in rice cultivation is the lowest (maximum only 30 percent), since
it is highly mobile within the soil plant system. This is why
urea is usually applied in splits at different stages of crop
growth to minimise the loss of applied urea and improve the efficiency
of nitrogen use. The fate of applied urea is: uptaken by the plants
(up to 33%), loss through volatilisation, surface run off and
leaching down. A large fraction of the applied urea is volatilized,
which eventually causes environmental pollution. Flexibility of
the farmers in adjusting the timing and amount of fertilizer applied
offers great potential to synchronise N application with the demand
of the rice crop in real time. When N application is not synchronized
with crop demand, N losses from the soil plant system are large
leading to low N fertilizer use efficiency.
Farmers in many parts of the world tend to apply excess amounts
of N in quest of achieving higher yield of rice. Urea is one of
the cheapest among all fertilizers and is required in large quantity.
This is another reason why farmers usually apply urea in amounts
more than required, sometimes to compensate for deficiency of
other more expensive fertilizers e.g. TSP, MP etc. Excess use
of urea is detrimental to crops and environment. Because of over
use of urea, more vegetative growth often takes place at the cost
of reproductive growth resulting in lower yield. Plants get lodged
causing sterility, more insect and disease infestation lead to
lower yield and higher pest management costs. It is, therefore,
necessary to apply urea in a judicious way based on plant's demand.
Need-based N application
N deficiency is the most commonly detected nutrient deficiency
symptom in rice. Old leaves and sometimes all leaves become light
green to chlorotic at the tip. Leaf colour and canopy appearance
are the visual indications of nitrogen deficiency in rice plants
and are, therefore, the indicators for determining the time of
urea application. Because leaf N content is closely related to
photosynthetic rate and biomass production, it is a sensitive
indicator of dynamic changes in crop N demand within a growing
season. Farmers, therefore, generally use leaf colour as a visual
and subjective indicator of the crop's N status and need for N
fertilizer application. Soil and plant analysis for N availability
is another means of determining the need for applying N fertilizer.
However, soil analysis is not an easy way of doing so and such
analytical facility is also not that available to farmers. Thus,
it is not practical as part of routine soil analysis. Soil tests
for N fertilizer recommendation in flooded rice field have not
been successful.
The chlorophyll meter, also known as soil plant
analysis development (SPAD) meter can quickly and reliably assess
the leaf area based N status of a crop. It has been successfully
used for rice and other cereal crops. The principle underlying
SPAD as a diagnostic tool to determine rice plant's need for additional
fertilizer N is based on the fact that rice leaf N concentrations
are positively correlated with rice yield and that leaf N correlates
with leaf greenness. Leaf Colour Chart (LCC) is another simple
and inexpensive instrument to assess the need of the rice plants
for nitrogen and to apply the right amount of nitrogen fertilizer
(urea).
What is a Leaf Colour Chart (LCC)?
LCC is basically a four inch (previously it was 6 inch) plastic
colour device having four separate strips of colour in it. The
colour gradients are from light yellowish green to dark green.
The first leaf colour chart was developed in Japan. Chinese researchers
developed a much improved LCC and calibrated it for indica, japonica
and hybrid rice. This chart later became a model for the LCC currently
distributed by IRRI's Crop Resources and Management Network (CREMNET).
The colour chart is an ideal tool to optimise nitrogen use in
rice cropping irrespective of nitrogen source applied -- organic
or inorganic.
The instrument is being increasingly used in
many Asian countries like Japan, Vietnam, China, Philippines and
India to determine the real time based N application.
The strip 2 (of the modified version) is yellow,
located on the left most corner of the LCC and the strip 5 is
deep green on the right most corner. The strips in between (numbering
3-4) are green in varying proportion, with the gradients being
increasingly deeper rightwards. There is a critical value for
LCC by which the need for urea application is determined, varying
over transplanted and direct wet-seeded rice. The suggested LCC
critical value is 3.5 for transplanted aman and boro rice. The
equivalent value for high-density direct wet-seeded rice is 3.0.
If the "greenness" of paddy canopy is found at or below
the critical value, it means the paddy needs urea and if the "greenness"
is found above the critical value, it will indicate that there
is already adequate N supply for the rice crop and there is no
need to apply more.
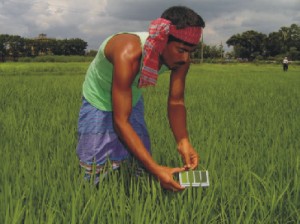
How to use the colour chart?
* Take LCC readings from 14 days after transplanting for transplanted
rice or 21 days after seeding for direct wet-seeded rice in Aman
season. But in Boro season, it should be done one week later.
The last reading is taken when the crop is at the stage of first
flowering.
*Take readings at the same time of the day
(9 am to 11 am or 2 pm to 4 pm) with the sun at your back to shade
the leaf being measured. The same person should take the leaf
colour measurements throughout the crop period who has the experience
or judgment in colour variation isolation.
*Select at random at least 10 disease or insect
pest damage free rice plants in a field with uniform plant population.
*Compare the colour of the uppermost fully
expanded leaf of the 10 selected plants by placing its middle
part on top of the colour strips in the chart. If the leaf colour
falls between two grades, the mean of the two values is taken
as the LCC reading. For example, if the leaf colour lies between
chart values 3 and 4, it is noted as 3.5. Do not detach or destroy
the leaf. During taking reading, you should move in the fields
very carefully.
*If six or more leaves read bellow a set critical
value (3.5 for transplanted and 3.0 for direct wet-seeded rice)
apply 7.5 kg urea per bigha (33 decimal) in T. aman and 9.0 kg
urea per bigha land in boro season.
*Repeat the process every 7-10 days or at critical
growth stages (early tillering, active tillering, panicle initiation
and first-flowering).
*If the LCC value on the day of measurement
is found above the critical value, take the LCC reading again
after 5 days and apply urea, if needed.
Remember that LCC is used to asses only N requirement
of rice plants, other fertilizers must be applied as recommended.
The visual symptoms of N deficiency can be confused with those
of sulfur deficiency which tends to first affect the younger leaves
or all leaves on the plant. Slight N deficiency can also be confused
with iron deficiency but the latter affects the emerging leaf
first.
Potential benefits of LCC
LCC as a tool for guiding N management in rice has been tested
at on-farm and on-station. The use of LCC-based N management has
been found to save about 20 kg N ha-1 (equivalent to about 45
kg urea, which is worth taka 270/-) in West Bengal, India. In
Bangladesh, LCC has been validated by BRRI scientists under farmers'
conditions since 2000 in collaboration with the International
Rice Research Institute (IRRI). It has been observed that LCC-based
N management increased yields of both aman and boro rice to some
extent. However, there is significant amount of urea saving due
to LCC-based N management. This urea saving was 50-60 kg per hectare,
which is equivalent to Taka 300-400. In Bangladesh, the potential
area for LCC-based N management has been estimated to be about
four million hectares of which about 1.5 million hectares are
for T. aman and about 2.5 million hectares for boro season. LCC-based
N management may result in a potential national benefit of Taka
1306 million which will come from savings of urea. The figure
will be multiplied several times if the value of additional rice
yield is considered.
LCC has been successfully tested and validated
with the high yielding rice varieties. The technology is currently
being disseminated by BRRI and the Department of Agricultural
Extension (DAE). Some NGOs are also disseminating the technology
to the farmers. Efforts should be made by all concerned to strengthen
the upscale of this useful technology by the farmers so as to
improve national resource conservation, improve land productivity
and protect environment.
Limitation of LCC use
*LCC can assess only the leaf colour but sometimes the assessment
through LCC may not be 100 percent accurate.
*Genetic variation of different rice varieties
in respect of natural leaf colour must be considered. The critical
value 3.0 or 3.5 is not always true for all the cultivars.
*Perception of the LCC reading takers regarding
leaf colour variation should be justified.
*Taking of LCC reading should be avoided just
after rain, especially in monsoon even the day after rain since
it may produce misleading result.
Dr. Musherraf Husain is Chief Scientific
Officer, ARD, BRRI, Gazipur.
|